Variables
Timeline variables let you create hundreds of unique trials from a single component template using a spreadsheet interface. Perfect for multi-trial experiments like Stroop tasks, memory studies, or any experiment where you need systematic stimulus variation across trials.Overview
Timeline variables enable:- Trial-by-trial variation - Different stimuli, parameters, or settings each trial
- Efficient experiment building - 160 trials from one template, not 160 components
- Systematic control - Define exact trial parameters in spreadsheet
- Data organization - Each row represents one trial with all parameters
- Import/export - Work with CSV files and external tools
- Randomization - Shuffle trial order automatically
- Multi-trial experiments (20+ trials)
- Systematic stimulus variation (different words/images each trial)
- Counterbalancing conditions
- Complex trial structures with many parameters
- Any time you’d build the “same” component many times with slight variations
Timeline Variables Concept
The core idea: Each row = one trial.How It Works
- Create a component template - Build one trial with variable placeholders
- Define variables in spreadsheet - Each row is one trial, columns are parameters
- Map columns to elements - Link spreadsheet columns to component properties
- Variables substitute automatically - System generates unique trial for each row
- Create 160 separate components manually
- Each with different word, color, correct key
- Time-consuming, error-prone, hard to modify
- Create 1 component template
- Add 160 rows to variables spreadsheet
- Each row specifies: word, color, congruency, correct key
- System generates 160 trials automatically
Each Row = One Trial
The spreadsheet structure:| Trial | Word | Color | Congruent | CorrectKey |
|---|---|---|---|---|
| 1 | RED | red | yes | F |
| 2 | BLUE | yellow | no | J |
| 3 | GREEN | green | yes | F |
| … | … | … | … | … |
| 160 | YELLOW | blue | no | J |
Columns = Trial Parameters
Each column represents one variable that changes across trials:- Stimulus content - Words, numbers, image filenames
- Display properties - Colors, positions, sizes
- Response configuration - Correct keys, feedback messages
- Trial metadata - Condition labels, block numbers
- Timing - Variable durations (if needed)
Variable Substitution in Components
Use${columnName} syntax in component elements:
Text element:
- Trial 1:
${word}→ “RED”,${color}→ red,${correctKey}→ “F” - Trial 2:
${word}→ “BLUE”,${color}→ yellow,${correctKey}→ “J” - And so on for each row in variables
Generating Many Trials from One Template
Single template component:- Add text element with
${word}as content - Set text color to
${color} - Configure valid keys: F, J
- Set correct response to
${correctKey}
- Each row defines word, color, and correctKey
- System creates 160 unique trials at runtime
- All using the same template component
- Change template once, affects all 160 trials
- Add new trials by adding rows
- Modify trial parameters by editing cells
- Export/import for collaboration or reuse
When to Use Variables
Perfect Use Cases
Multi-trial cognitive tasks:- Stroop task (160 trials, varying word/color)
- N-Back task (100 trials, varying stimuli)
- Visual search (80 trials, varying target/distractor)
- Recognition memory (200 trials, old/new items)
- Lexical decision (300 trials, words/nonwords)
- Show each image from set exactly once
- Counterbalance condition order
- Present stimuli in predefined sequence
- Vary stimulus parameters systematically
- Multiple parameters per trial (stimulus, condition, block, difficulty)
- Trial-specific feedback messages
- Variable timing across trials
- Conditional correct responses
When NOT to Use Variables
Simple repetition:- Same stimulus 20 times → Use loop frame instead
- No parameter variation → Variables unnecessary
- 5-10 trials → Faster to create separate components
- Overhead of variables not worth it
- If random selection from pool → Use per-stimulus frame
- Variables better for systematic, controlled variation
The Variables Spreadsheet
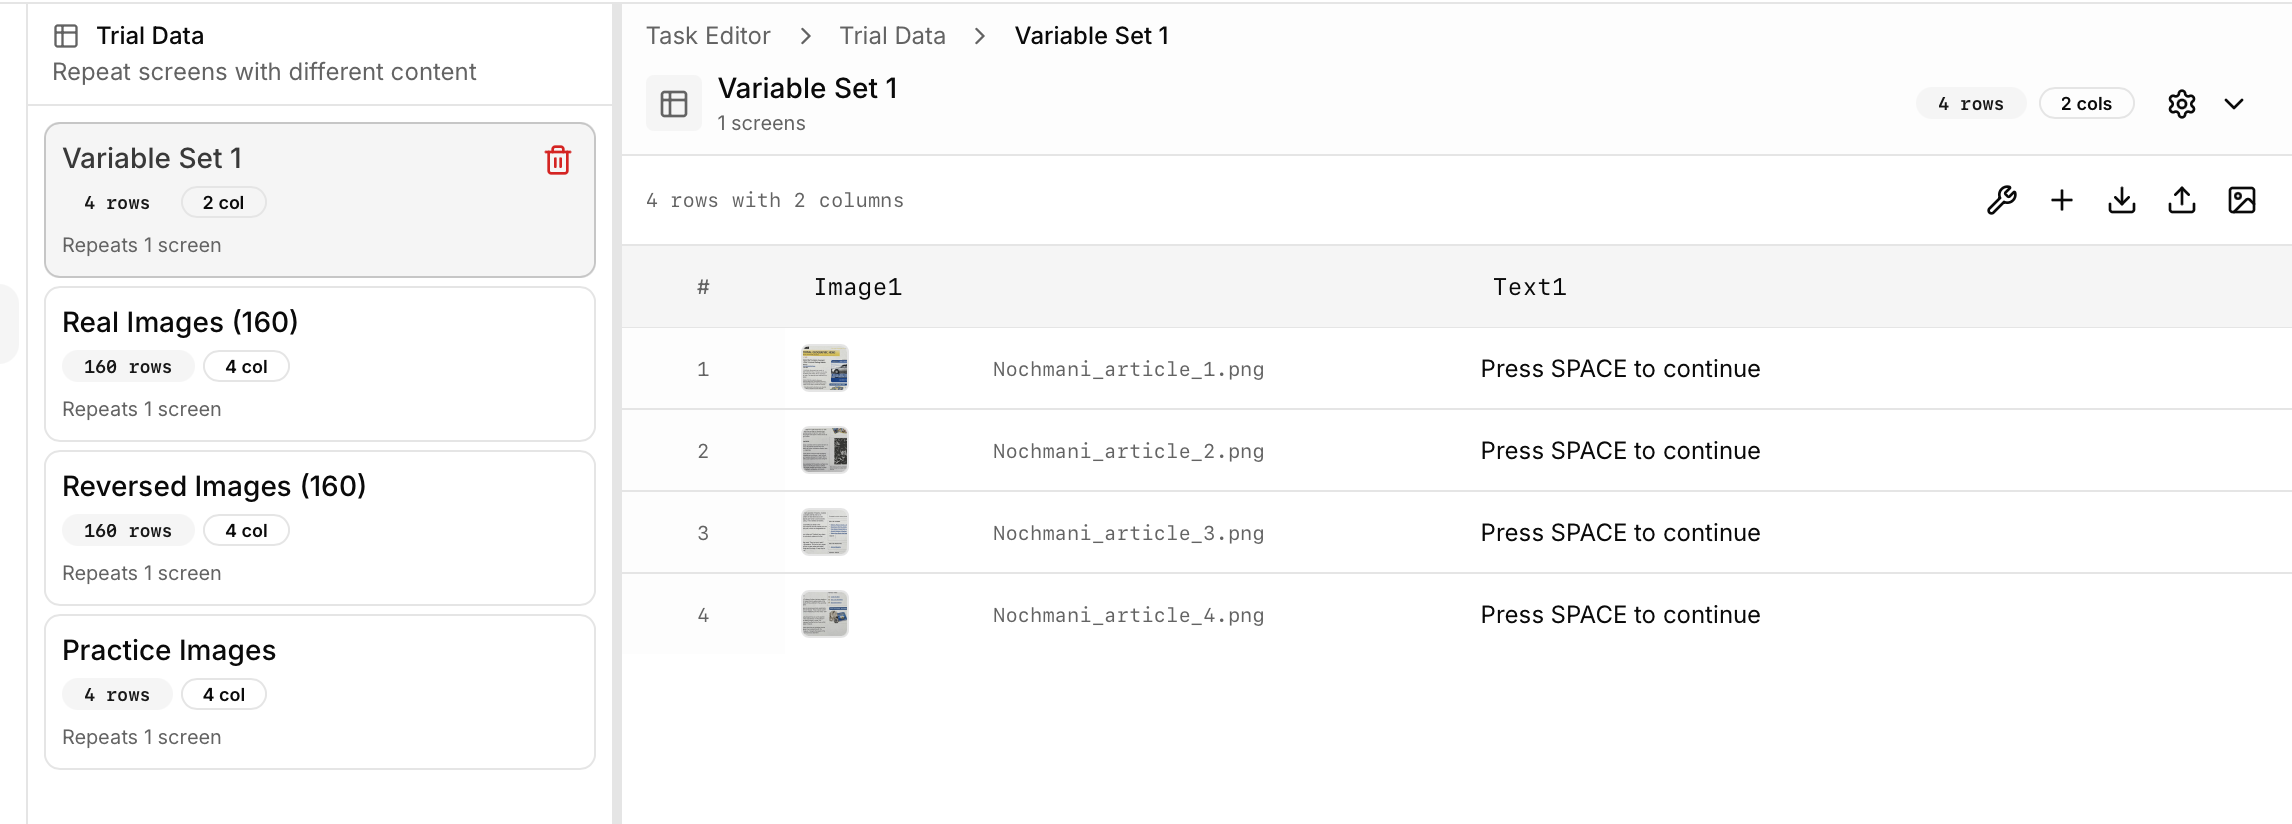
The Variables view shows a spreadsheet-style editor for defining trial parameters.Spreadsheet Interface
Features:- Rows - Scroll through thousands of trials
- Columns - Add unlimited parameters
- Cells - Click to edit individual values
- Headers - Column names (variable names)
- Row numbers - Trial indices (1, 2, 3…)
- Handles 1000+ rows smoothly
- Only renders visible cells for performance
- Scroll with mouse wheel or keyboard arrows
Adding Rows (Trials)
Add single row:- Click ”+ Add Row” button
- New trial row appears at bottom
- Fill in values for each column
- Click ”+ Add Rows” button
- Specify number (e.g., 50)
- 50 blank rows added
- Fill in systematically or import
- Right-click row number
- Select “Insert Row Above/Below”
- New blank row inserted at position
Adding Columns (Parameters)
Add column:- Click ”+ Add Column” button
- Enter column name (e.g., “word”, “color”, “correctKey”)
- Select column type (text, image, number, etc.)
- Column appears on right
- Use descriptive names: “stimulus”, “condition”, “blockNumber”
- No spaces (use camelCase or snake_case): “correctKey” or “correct_key”
- Match exactly when using
${columnName}in components
- Drag column header to new position
- Useful for grouping related parameters
- Right-click column header
- Select “Delete Column”
- Confirm deletion (can’t undo)
Editing Cells
Click to edit:- Click cell
- Type new value
- Press Enter or Tab to save
- Or click outside cell
- Tab - Move to next cell (right)
- Shift+Tab - Move to previous cell (left)
- Enter - Move down one row
- Arrow keys - Navigate in any direction
- Copy cell:
Cmd/Ctrl + C - Paste:
Cmd/Ctrl + V - Copy range: Select multiple cells, copy, paste
- Select cell with value
- Drag fill handle (bottom-right corner) down
- Value copies to all cells in range
- Or select range and use “Fill Down” menu option
Column Types
Different data types for different parameters.Text Columns
Plain text values for words, labels, conditions. Use cases:- Stimulus words (Stroop: “RED”, “BLUE”, “GREEN”)
- Condition labels (“congruent”, “incongruent”)
- Feedback messages (“Correct!”, “Try again”)
- Participant instructions varying by trial
| word | condition | feedback |
|---|---|---|
| RED | congruent | Correct! |
| BLUE | incongruent | Incorrect, try again |
Image Columns
References to image files in media library. Use cases:- Stimulus images (faces, objects, scenes)
- Target and distractor images
- Feedback icons (checkmark, X)
- Variable backgrounds
- Click cell in image column
- “Select Image” button appears
- Choose from media library
- Filename fills cell automatically
- Type filename directly (e.g., “face_001.jpg”)
- Must match exact filename in media library
- Include file extension (.jpg, .png)
Audio Columns
References to audio files. Use cases:- Spoken words
- Tones or beeps
- Music clips
- Ambient sounds
- Select from media library
- Or type filename (e.g., “tone_440hz.mp3”)
Video Columns
References to video files. Use cases:- Video stimuli
- Instructional clips
- Dynamic scenes
Number Columns
Numeric values for quantitative parameters. Use cases:- Difficulty levels (1, 2, 3)
- Display durations in milliseconds
- Target positions (X, Y coordinates)
- Confidence ratings (1-7)
- Reaction time thresholds
| difficulty | duration | targetX | targetY |
|---|---|---|---|
| 1 | 2000 | 400 | 300 |
| 2 | 1500 | 600 | 450 |
Correct Response Columns
Special column type for defining correct answers. Use cases:- Correct keyboard key (“F”, “J”, “Space”)
- Correct button choice (“Left”, “Right”)
- Correct numeric answer (for math tasks)
- Correct yes/no response
| stimulus | correctKey | correctAnswer |
|---|---|---|
| dog | F | animal |
| chair | J | furniture |
Adding Variables Step-by-Step
Complete workflow for setting up timeline variables.Step 1: Open Variables View
- In Task Editor, click Variables in left sidebar
- Or press
Vkeyboard shortcut - Variables spreadsheet opens
Step 2: Add Columns for Trial Parameters
Think about what varies across trials: For Stroop task:- word (what word to display)
- color (display color)
- congruent (yes/no or congruent/incongruent)
- correctKey (F or J)
- Click ”+ Add Column”
- Name: “word”, Type: Text
- Click ”+ Add Column”
- Name: “color”, Type: Text
- Click ”+ Add Column”
- Name: “congruent”, Type: Text
- Click ”+ Add Column”
- Name: “correctKey”, Type: Text
Step 3: Add Rows for Trials
- Click ”+ Add Rows”
- Enter number of trials (e.g., 160)
- 160 blank rows appear
Step 4: Fill in Trial Data
Option A: Manual entry- Click each cell and type value
- Use Tab/Enter to navigate
- Copy/paste for repeated values
- Enter first value
- Drag fill handle to copy down
- Useful for repeated blocks
- Prepare data in Excel/Google Sheets
- Export as CSV
- Import to Cajal (see Import section below)
| word | color | congruent | correctKey |
|---|---|---|---|
| RED | red | yes | F |
| RED | yellow | no | J |
| BLUE | blue | yes | J |
| BLUE | red | no | F |
| …continuing for 160 rows |
Step 5: Map Columns to Component Elements
Link spreadsheet columns to component properties:- Switch to Screens view
- Select component to vary (e.g., stimulus component)
- Select element within component (e.g., text element showing word)
- In properties panel, find property to vary (e.g., text content)
- Click variable icon next to property
- Select column from dropdown (e.g., “word”)
- Property now shows
${word}instead of fixed value
- Text element content →
${word} - Text element color →
${color} - Response configuration correct key →
${correctKey}
Step 6: Create Frame with Variables
- Switch to Flow view
- Select component(s) that use variables
- Right-click → “Create Frame”
- Select “Per-Trial Variables” frame type
- Frame created - component will repeat for each row in variables
Step 7: Preview with Variables
- Start preview (press
P) - Set to preview subset (e.g., first 10 trials)
- Run through trials
- Verify each trial shows different values from variables
- Check substitution working correctly
Column Mapping
Connect spreadsheet columns to component properties.Mapping Process
For text properties:- Select text element
- Find “Text Content” in properties
- Click variable link icon
- Choose column (e.g., “word”)
- Property updates to
${word}
- Select image element
- Find “Image Source” in properties
- Click variable link icon
- Choose column (e.g., “stimulus”)
- Property updates to
${stimulus} - System appends file extension automatically (if not in variable)
- Select component (not element)
- Open response configuration section
- Find “Correct Response” field
- Click variable link icon
- Choose column (e.g., “correctKey”)
- Value updates to
${correctKey}
Using $ Syntax
Alternative to GUI mapping: type variable syntax directly. In text element:- Use exact column name (case-sensitive)
- Wrap in
${}brackets - Can combine with literal text
- Multiple variables in same property allowed
Mapping to Multiple Elements
One column can map to multiple elements. Example: Same stimulus in multiple locations- Header text: ”$”
- Center display: ”$”
- Footer reminder: “Remember: $”
Multiple Columns in One Element
One element can use multiple variables. Example:- condition: “Congruent”
- correctKey: “F”
- targetWord: “RED”
Import and Export
Work with external spreadsheet tools for complex data preparation.Importing CSV Data
Prepare trials in Excel or Google Sheets, import to Cajal. Prepare CSV file:- Create spreadsheet with trial data
- First row = column names (variable names)
- Subsequent rows = trial data
- Save as CSV (comma-separated values)
- Variables view → Import button
- Select CSV file
- Map CSV columns to variable columns (if names don’t match exactly)
- Preview import
- Confirm - data fills spreadsheet
Bulk Data Entry
For patterns or formulas:- Generate data in Excel using formulas
- Example: Counterbalanced trial order
- Export as CSV
- Import to Cajal
- Randomize:
=RAND()then sort by random column - Repeat pattern:
=MOD(ROW()-2, 4)+1for 1,2,3,4 repeating - Lookup:
=VLOOKUP()to match stimulus to correct response
Exporting for Backup
Download variables for backup or sharing. Export steps:- Variables view → Export button
- Choose format (CSV or Excel)
- Download file
- Store in version control or share with collaborators
- Backup before major changes
- Share trial list with co-authors
- Document exact stimulus order
- Recreate experiment elsewhere
Using Spreadsheet Software to Prepare Data
Advantages of Excel/Sheets:- Familiar interface
- Advanced formulas and functions
- Conditional formatting for QC
- Scripts for automation (e.g., Python pandas)
- Collaboration features (Google Sheets)
- Design trial structure in Excel
- Generate/randomize trials
- Add formulas for counterbalancing
- Quality check (conditional formatting to spot errors)
- Export as CSV
- Import to Cajal
- 4 conditions (A, B, C, D)
- Each participant sees random order
- Use Excel RAND() and SORT to create randomized lists
- Export multiple CSV files (one per participant order)
Randomization
Shuffle trial order to prevent order effects.Randomizing Trial Order
Enable randomization:- Variables view → Randomization settings
- Toggle “Randomize trial order”
- Choose randomization method:
- Complete randomization - Pure random shuffle
- Block randomization - Randomize within blocks
- Constrained randomization - Prevent certain orders
- Each participant sees trials in different order
- Variables spreadsheet order is template, not actual presentation order
- Prevents order effects, practice effects, fatigue confounds
Shuffling Rows
Randomize within the spreadsheet editor (for visualization or export). Shuffle button:- Click “Shuffle Rows”
- Rows reorder randomly
- This changes template order (affects all participants unless per-participant randomization enabled)
- Create random order as default
- Shuffle between pilot sessions
- Generate randomized export
Random Sampling
Present random subset of trials instead of all. Use cases:- 100 total stimuli, show 50 random each participant
- Reduce experiment length
- Vary difficulty by sampling easy vs. hard trials
- Variables view → Sampling settings
- Enable “Sample trials”
- Set sample size (e.g., 50 out of 100)
- Choose sampling method:
- Without replacement - No repeats
- With replacement - Trials can repeat
- 200 word stimuli defined in variables
- Sample 100 without replacement
- Each participant sees 100 unique words (randomly selected from the 200)
- Different participants see different subset
Sampling Options
Control which trials are presented.Fixed Number of Trials
Sample specific number from total. Settings:- Total trials defined: 200
- Sample size: 80
- Each participant sees: 80 randomly selected
With vs. Without Replacement
Without replacement:- Each trial selected at most once
- 80 samples from 200 = 80 unique trials
- No repeats
- Trials can be selected multiple times
- 80 samples from 200 = 80 trials, some may repeat
- Less common for cognitive tasks
Weighted Sampling
Assign probability weights to trials. Use case:- Show hard trials more frequently
- Oversample rare conditions
- Adaptive difficulty
- Add “weight” column to variables
- Assign weights (e.g., 1 for easy, 3 for hard)
- Enable weighted sampling
- Trials selected proportional to weights
| trial | difficulty | weight |
|---|---|---|
| 1 | easy | 1 |
| 2 | hard | 3 |
Repetitions
Repeat entire variable set for multiple blocks.Repeating Entire Variable Set
Use case:- Same 40 trials, repeat 4 times = 160 total trials (4 blocks)
- Practice block followed by test blocks
- Variables view → Repetitions setting
- Set repetition count (e.g., 4)
- 40 trials × 4 repetitions = 160 presentations
- If randomization enabled: each repetition randomly ordered
- If not randomized: same order each repetition
Multiple Blocks with Same Trials
Combined with randomization:- Repetition 1: Trials in order A
- Repetition 2: Trials in order B (different random order)
- Repetition 3: Trials in order C
- Repetition 4: Trials in order D
Block Intermissions
Insert break screens at regular intervals.Purpose of Intermissions
Why add breaks:- Long experiments (160+ trials) cause fatigue
- Eye strain from continuous focus
- Maintain data quality
- Participant welfare
- Standard practice for long tasks
- Experiments >15 minutes
- Attention-demanding tasks
- High trial counts (>80 trials)
Configuring Intermissions
Settings:- Variables view or Frame properties → Intermissions
- Enable “Block intermissions”
- Set interval (e.g., “Every 40 trials”)
- Choose intermission component:
- Use existing break component
- Or create new intermission screen
- 160 total trials
- Intermission every 40 trials
- Breaks appear after trial 40, 80, 120
- 4 blocks with 3 breaks
Rest Screens Every N Trials
Intermission content:- “Take a break”
- “Press space when ready to continue”
- Progress indicator: “40 out of 160 complete”
- Optional timer: “Minimum 15 second break”
- Add new Instruction component
- Add text: “Take a short break”
- Add text: “Press space to continue when ready”
- Optional: Add minimum view time (e.g., 15 seconds)
Attention Checks
Use intermissions for attention checks: Simple attention check:- “What color was the previous stimulus?”
- Must answer correctly to continue
- Detects inattentive participants
- Create attention check question
- Mark as intermission component
- Insert every 30-50 trials
- Score and flag low-accuracy participants
Break Frequency Configuration
Recommendations:- Every 40-60 trials for standard tasks
- Every 20-30 trials for demanding tasks
- Every 80-100 trials for easy tasks
- Task difficulty
- Trial duration (short trials = more frequent breaks)
- Stimulus complexity
- Participant population (children need more breaks)
- Fixed interval: Every N trials exactly
- Time-based: Every X minutes
- Adaptive: Based on performance decline
Common Variable Patterns
Stroop Task Example
Classic color-word Stroop with full trial specification. Columns:| word | color | congruent | correctKey | block |
|---|---|---|---|---|
| RED | red | yes | F | 1 |
| RED | yellow | no | J | 1 |
| BLUE | blue | yes | J | 1 |
| BLUE | red | no | F | 1 |
| GREEN | green | yes | F | 2 |
| GREEN | blue | no | J | 2 |
| YELLOW | yellow | yes | J | 2 |
| YELLOW | green | no | F | 2 |
- 40 congruent trials (word matches color)
- 40 incongruent trials (word doesn’t match color)
- 80 neutral trials (word doesn’t denote color)
- Across 4 blocks
- Text element content:
${word} - Text element color:
${color} - Correct response:
${correctKey}
Memory Task Example
Recognition memory with old/new items. Columns:| stimulus | condition | block | correctResponse |
|---|---|---|---|
| face_001.jpg | old | study | - |
| face_002.jpg | old | study | - |
| face_001.jpg | old | test | yes |
| face_002.jpg | old | test | yes |
| face_101.jpg | new | test | no |
| face_102.jpg | new | test | no |
- condition=“old”, block=“study”
- No response required (just encoding)
- condition=“old” or “new”, block=“test”
- correctResponse: “yes” if old, “no” if new
- Study phase: Show only rows where block=“study”
- Test phase: Show only rows where block=“test”
Questionnaire Example
Survey with varying questions and scale types. Columns:| question | scale | reverse_scored | category |
|---|---|---|---|
| How happy do you feel? | 1-7 | no | mood |
| How sad do you feel? | 1-7 | yes | mood |
| How anxious do you feel? | 1-7 | yes | anxiety |
| How relaxed do you feel? | 1-7 | no | anxiety |
| How energetic do you feel? | 1-5 | no | arousal |
- Text element:
${question} - Likert scale points: Vary based on
${scale}column - Scoring: Reverse if
${reverse_scored}= “yes”
- Easy to add/remove questions
- Export as CSV for scoring in R/Python
- Randomize question order
Variable Substitution Details
How${columnName} syntax works in different contexts.
In Text Elements
Simple substitution:In Image Elements
Image filename:In Feedback Messages
Dynamic feedback based on response:Special Variables
Some variables are auto-generated: System variables:${trialNumber}- Current trial index (1, 2, 3…)${blockNumber}- Current block (if using blocks)${rt}- Reaction time from previous response${accuracy}- Running accuracy percentage${response}- Participant’s most recent response
Advanced Features
Conditional Logic with Variables
Use variables to control branching. Example:Computed Values
Define columns based on other columns. Example:Variable-Based Branching
Different experimental paths based on variable values. Example:Tips and Best Practices
Start with Small Test Set
Don’t create all 160 trials immediately:- Design first 10 rows carefully
- Test with preview - verify substitution works
- Check all conditions represented
- Expand to full set only after testing
Use Descriptive Column Names
Good names:stimulus,correctResponse,condition,blockNumber
col1,x,data,stuff
${columnName}, clear names make components self-documenting.
Check Variable Substitution in Preview
Always verify:- Run preview with first 5-10 trials
- Check each trial shows expected values
- Verify images load correctly
- Confirm correct responses match stimuli
- Typo in column name:
${correctkey}vs${correctKey} - Missing images: filename doesn’t match media library
- Wrong column mapped to property
Keep Backup of Variable Data
Before major changes:- Export variables to CSV
- Save with version/date:
stroop_variables_2024-11-27.csv - Commit to version control (Git) if using
Document Your Variable Scheme
Add README or notes:- What each column represents
- Value coding (e.g., “F” = red, “J” = green)
- Trial structure (blocks, conditions)
- Counterbalancing scheme
Use Spreadsheet QC Techniques
Quality control in Excel:- Conditional formatting - Highlight errors (e.g., correctKey not F or J)
- Data validation - Restrict values (dropdown: F, J only)
- Formulas - Auto-compute derived values
- Pivot tables - Check trial counts per condition
- Imbalanced conditions
- Missing values
- Typos in categories
- Incorrect response mappings
Next Steps
Now that you understand timeline variables:Preview
Test your variable substitution
Flow View
Create frames around variable trials
AI Assistant
Use AI to generate trial variables
Sharing
Collect data from real participants